Assignment #5
You are to create a spreadsheet using the information you collect from a survey you will conduct.
You need to survey at least the number of students in this class. Don’t be afraid to ask friends and family members outside this class for their input. The more you ask, the better the project will be. Keep the survey simple by only asking one question. You may choose your topic from one of these options:
1. What type of soft drink do you like best?
2. What type of music do you prefer?
3. What is your favorite sports team?
4. What is your favorite carmaker?
5. What is your favorite type of candy/gum?
It would be better to already have the choices written down (about 10) and let them choose from your list. After collecting the data, you will be entering this into MS Excel and creating a graph to visually display your findings.
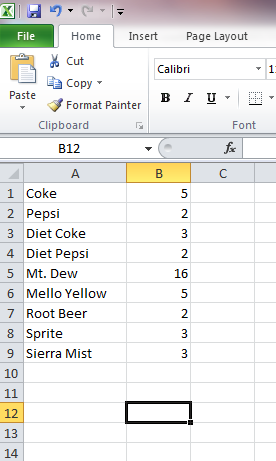
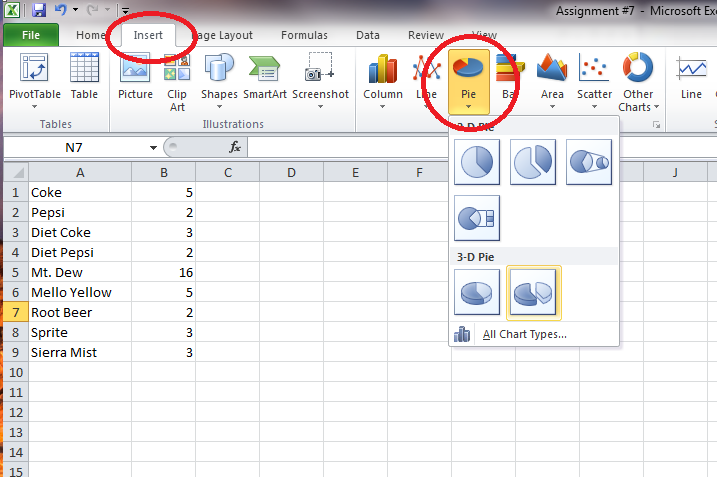
After entering your data, HIGHLIGHT, OR SELECT, THE DATA, then click insert, and pie. Then choose your chart style.
Make sure you choose this chart layout so you can add a title, and add the data labels to the pie pieces.
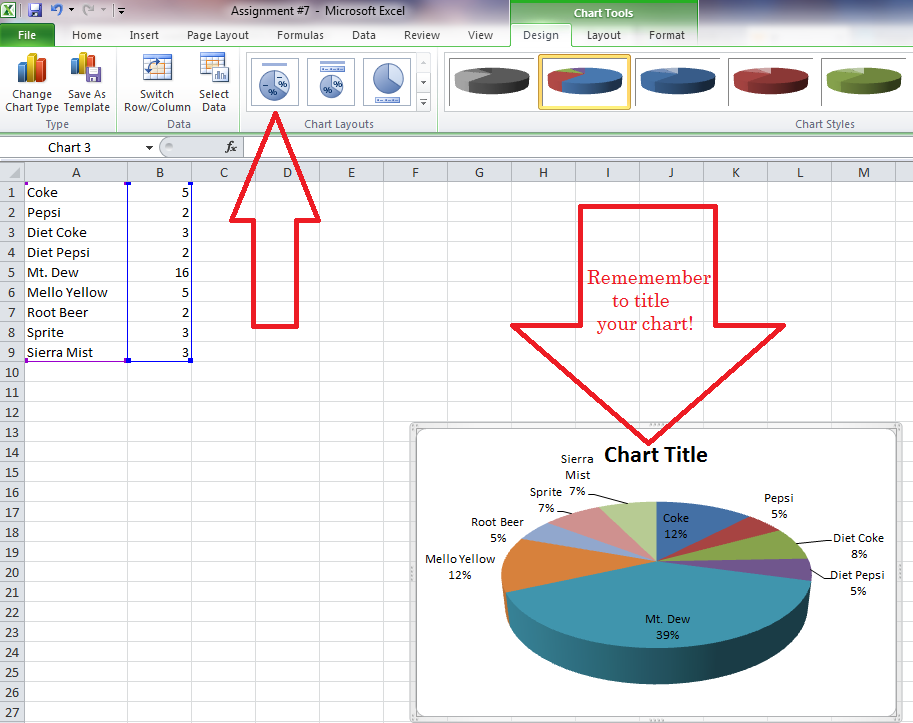
Right-click and copy your chart. You'll need it later. Be sure to save this incase you don't finish today.
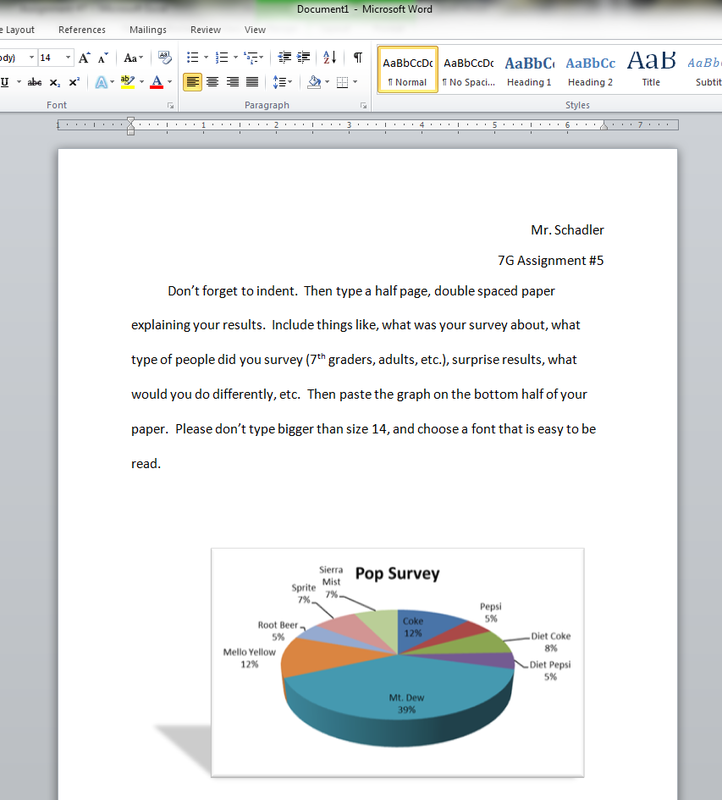
From your graph, you will be typing a half page, double spaced paper in MS Word explaining your results, including a pie chart of your data on the bottom half.
From your graph, you will be typing a half page, double spaced paper in MS Word explaining your results, including a pie chart of your data on the bottom half.